

The COVID-AM blog is a partnership between the UMI 3157 iGLOBES and the Institut des Amériques, coordinated by François-Michel Le Tourneau, Deputy Director and Marion Magnan, researcher at the Institute. About the blog.
Covid-19 and other causes of mortality in São Paulo's outer districts
September 12, 2020

by Hervé Théry, Senior Researcher in Geography at the University of Paris Sorbonne Nouvelle and Professor at the Universidade de São Paulo

While in Brazil the first cases of Covid-19 were seen in the big cities, brought over from Europe and Asia by tourists who had the means to travel far, the epidemic quickly hit the poorest districts. Allowing that cartography has a heuristic and illustrative value, that it doesn't just show simple co-incidences, but that it can lead us to causal relationships, the following figures try to detect the factors associated to the disease. We can clearly see that it has been devastating on the outskirts of the city.
By using as criteria the causes of death per 100 000 inhabtiants by distrito of the São Paulo metropolis, figure 1 shows that the deaths caused by this epidemic has a similar distribution to those caused by AIDS (in the center and the outskirts on the East side of the city, the Zona Leste), while those caused by dementia and Alzheimer's are typical in the center, and those caused by alcoholism and homicides are on the outer perimeters of the city.
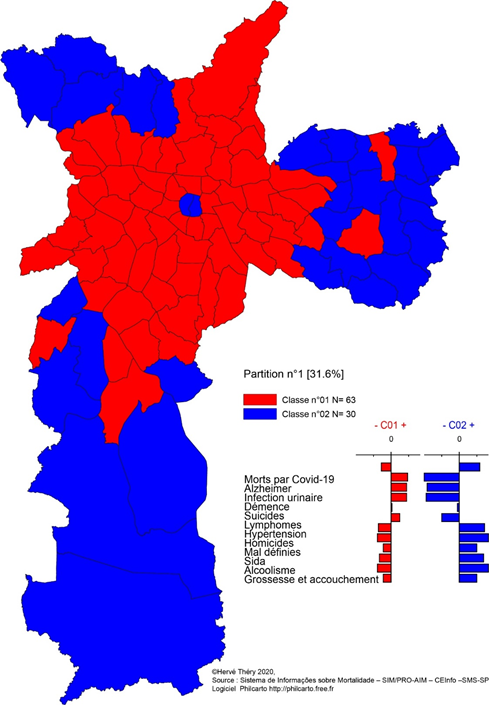
But when switching from analytical maps to a statistical process via a Hierarchical Ascendant Classification (HAC) - also called cluster analysis, which seems more appropriate to analyze the distribution of Covid-19 cases - the conclusions are a bit different. In this type of analysis, groups are formed, according to the analyzed variables. Once the groups have been created, you can analyze the profil of each by looking at the average of each variable: those are the horizontal lines next to the map, they lean toward the left when the group's numbers are under the average and to the right when they are above.
When focusing on only two groups (figure 2), two situations appear. In the first (red), the proportion of deaths linked to Covid-19 is below average, and in the second, it's the opposite. When looking at how the other variables are involved, we can see that the deaths linked to the pandemic are associated to other causes which characterize quite well - and sadly - the outer edges of the city, showing a significant contrast between them and the center of the city: alcoholism, homicides, hypertension, etc. vary in the same direction as the mortality that is attributed to SARS-CoV-2.
But if we go from two to four groups (figure 3), this time we can see that deaths linked to the pandemic contribute to the formation of several distinct groups. In group 3 (the larger portion in the center), they are under the average, while groupe 1, where they play the most limited role, draws a ring around the center and the peripheries. In group 2, homicides dominate, but group 4, which weighs in more, associates the northern and eastern outskirts of the city to its center, and even to its more central districts, next to the train stations around which the city developped during the coffee boom. That's where Cracolândia (a combination of crack+ lândia = land of crack) is located, situated between two train stations and the old São Paulo city bus station. As said in a recent article, the August 2020 data on the rate of Covid-19 cases per 100 000 inhabitants (figure 4) confirms that the outskirts of the city are the ones that are the most impacted by the pandemic and maps out a geography that is almost exactly what is seen in the analyses presented above.


Covid-19 definitely confirms its double blow feature: you have a bigger chance of getting hit by the pandemic if you are poor, diabetic and in a violent district on the outskirts of São Paulo than if you are rich and live in an apartment in a quiet neighborhood downtown...
Hervé Théry is an emeritus Senior Researcher at the University of Paris Sorbonne Nouvelle (CREDA) and Professor at the Universidade de São Paulo (USP-PPGH). A geographer, he has been studying Brazilian territorial disparities and dynamics since 1974, using thematic mapping and field work. He has been a member of the scientific committee of the Institut des Amériques.