

The COVID-AM blog is a partnership between the UMI 3157 iGLOBES and the Institut des Amériques, coordinated by François-Michel Le Tourneau, Deputy Director and Marion Magnan, researcher at the Institute. About the blog.
factors linked to the covid-19 epidemic in brazil
July 8, 2020

by Hervé Théry, Senior Researcher in Geography at the University of Paris Sorbonne Nouvelle and Professor at the Universidade de São Paulo
In order to contribute to the research on the Covid-19 epidemic in Brazil, it is possible to look for similarities and correlations between case distribution and that of social-economic data, on the basis that the occurrence of phenomena in the same spot is not a coincidence, but that it can point to causal relationships[1].
So, we can picture Brazil according to the town's social and economic characteristics, such as poverty, poor sanitary conditions, housing density occupancy, medical supplies, family composition and level of education. Local development can be added to that, measured with the IDMH (Índice de Desenvolvimento Humano Municipal) index, the percentage of public administration (which shows economic growth) and other social factors such as the color of the skin and religion[2]. All these data present, when they are represented on maps, resemblances with distribution maps of Covid-19 cases.
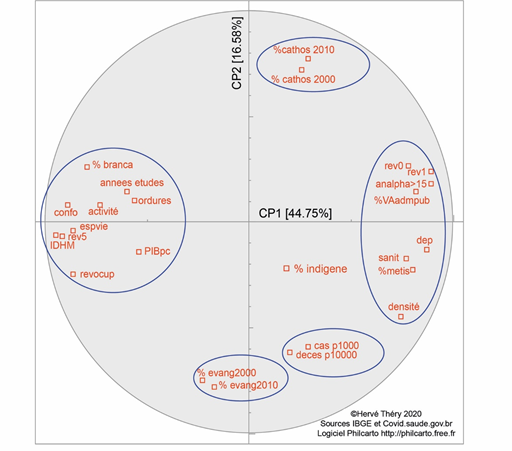
In order to verify the meaning of these correlations and simplify the display of numerous factors on one map, these data were associated in a principle component analysis (PCA) in factor analysis of which figure 1 shows the results. In a series of data, the PCA helps verify those that contribute the most to the variation from the sample and identify those that go in the same direction, or on the contrary, those that contradict each other. The gross results of the analysis are represented in diagram 1.
Groups of variables can be seen congregating around the same meaning. On the left of the image, we can find high values for the housing medical supplies, revenus, development index, the level of education, salary, profession, and the percentage of people who declared on the census that the color of their skin was "branca" (white). This is the developped Brazil. On the other side of the diagram, on the right, the values are high for the number of people without a salary or one inferior to minimum wage, the illiteracy rate of those over fifteen, the portion of public administration in the value added, the number of dependents in the household, housing density occupation and the inadequacy of the medical supplies, as well as the strong percentage of people with a "parda" skin color (mixed race). That's the poor Brazil.
On axis 2 of the analysis, which is read bottom to top, on one side are the towns with a significant percentage of inhabitants who have declared themselves catholics on the 2000 and 2010 census[3], on the opposite side those who declared themselves evangélicos (pentecostal protestants).
The variables linked to Covid-19 are in the bottom corner on the right of the diagram. So they vary in the same way to the data that show poverty and the data that indicate a stronger percentage of evangélicos.

The results were then transposed unto a map that puts the score of the 5 570 Brazilian municipios (towns) on axes that differenciate them according to the variables used (figure 2). This map is then compared to the map of number of Covid-19 cases (figure 3). The results of bringing these maps together confirms on a spacial level the PCA conclusion. The Covid-19 cases and deaths it caused are distinctly on the poor Brazilian side, identified on the right of diagram 1. The reasons are clear: how can the lockdown measures be respected if you need to go outside every day to earn what is needed to eat and feed your family? And how can you follow the health measures if you don't have the basic sanitary installations, notably in the favelas?
So the map putting the towns on axis 1 contrasts the most developped areas of the country, in blue, and the poorest in yellow and orange. The second one contrasts the regions where catholicism is still strong, in yellow, to those where the evangélicos have progressed the most[4], in blue, in Amazonia and in several urban regions of the southeast and northeast coast.
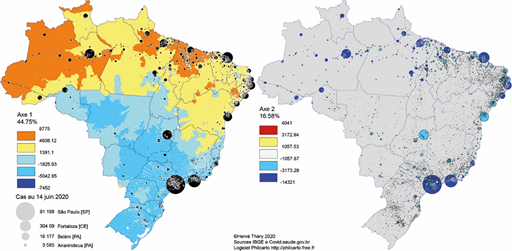
In proportion to the number of cases (known) of the disease, the first map definitely shows that there are more and bigger black circles in the poorest regions. Exceptions are the most populated cities of the country, São Paulo, Rio de Janeiro and Brasília, despite being located in the most developped areas of the country, which can essentially be explained by the presence of big pockets of poverty in these urban areas, concentrated in sectors where health insurance is insufficient.
On the second map, the change in colors goes from the blue of the evangélicos to the yellow and orange of the catholics, within circles proportional to the number of Covid-19 cases. You can see quite well that the biggest ones are rather blue/evangélicos in the big cities and in Amazonia, while the yellow/catholic cercles of sertão nordestin and the South (catholic and lutheran protestant) are barely visible because much smaller (for now at least because the epidemic is gaining more and more ground inside the country).
We can understand how poverty can play a role in the exposure to the disease. But how does being catholic or evangélico influence the number of Covid-19 cases? Among the precautions that help limit the risk of spreading the virus is avoiding gatherings in enclosed areas and close contact with people who could be infected. But, evangelical services actually gather lots of believers in churches where they sing together and kiss each other: cases linked to these practices were identified in South Korea and in France[5]. Furthermore, many of these churches refused to close or put social distancing measures in place between believers, in part from disbelief of the disease and in part because pastors wanted to stay in touch with their flock. So the religious factor can contribute to the distribution of Covid-19 cases, though less so than the other factors: axis 2 represents 16.5% of the variance against the 44.57% of axis 1 which illustrates the contrast between regions more or less developped.
So, analyzing social-economic data mainly demonstrates a strong link between Covid-19 cases and poverty and its consequences, on top of which the predominance of evangélicos or catholics however adds nuance. Correlation and causality should not be confused, but this dimension deserves to be taken into consideration, both for the analysis of the spread and the analysis of the actions taken - or not - to control it.
[1] A more complete version of this text (detailling the methodology and the variables, then using a second statistical analysis, the hierarchical ascendant classification/HAC) is available in French on the website of La Revue Géopolitique Diploweb and in Portuguese on the journal Confins'
[2] Cf ; "Covid-19 in Brazil: exacerbating factors, scenarios and risks".
[3] The last two available, the one from 2020 having been postponed because of the pandemic.
[4] The percentage of people declaring themselves catholics went from 73.6% to 64.6% between the 2000 and the 2010 census, while evangélicos went from 15.4% to 22.2%.
[5] The details of these cases are in the long versions mentioned in note 1.
Hervé Théry is an emeritus Senior Researcher at the University of Paris Sorbonne Nouvelle (CREDA) and Professor at the Universidade de São Paulo (USP-PPGH). A geographer, he has been studying Brazilian territorial disparities and dynamics since 1974, using thematic mapping and field work. He has been a member of the scientific committee of the Institut des Amériques.